Go to playground home.

Data Display

This page contains improvements to the AWR Design Environment for visualizing and analyzing data.


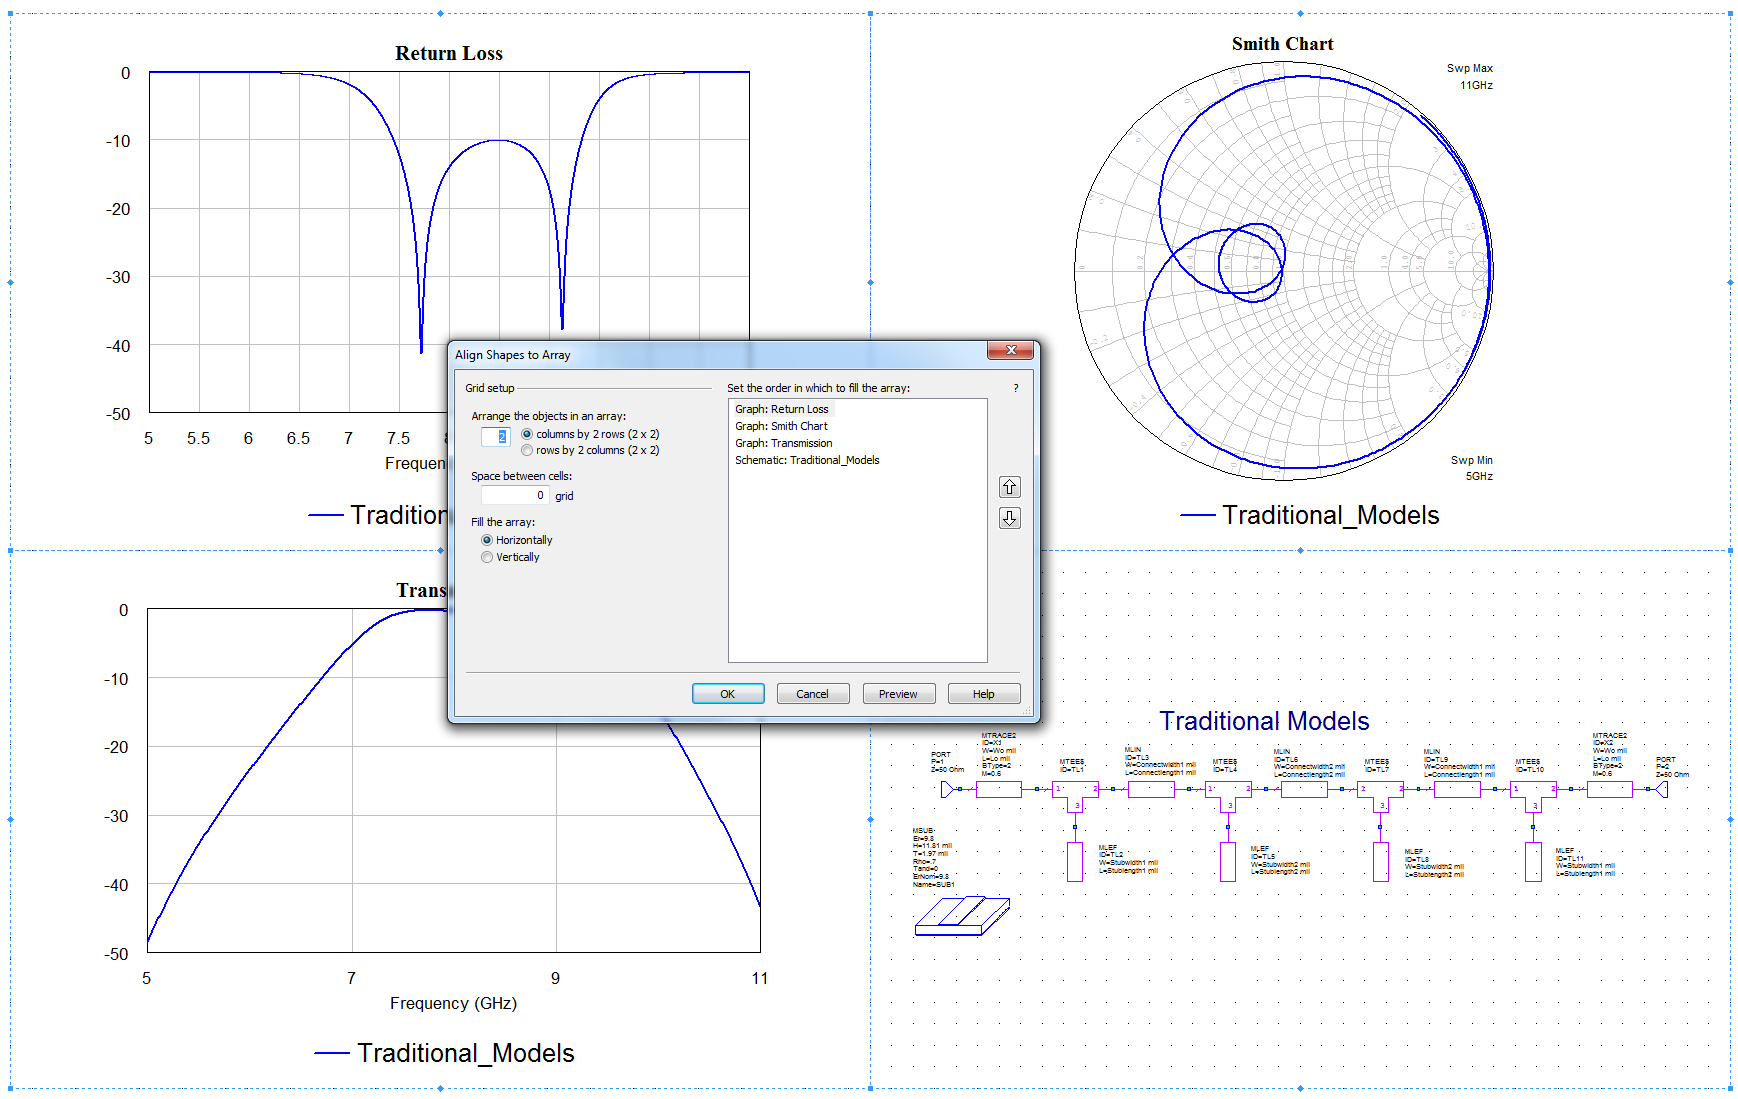
Create design-review-ready data reports with just a few mouse clicks.

Use the Insert Windows Command to generate pre-sized, pre-arranged Window in Window reports

The demo opens the project and opens a blank Output Equations page

  1. Choose Draw > Insert Windows to launch the Insert Windows command.
  2. Use the CTRL key for mutli-select and only choose all the Graphs and the Schematic and press OK.
  3. Note that a preview of the window placement is shown in the Output Equation Window.
  4. Change Fill the array to vertical, press the Preview button, and note that the Schematic is now the upper right window.
  5. Note that the array format is changeable and that the windows reordering is supported using the arrow keys.
  6. Push the OK button, and, if desired, drag the Schematic view such that it's lower edge is aligned with the lower edge of the Graphs in the lower row (i.e. make the display symmetrical).

Tired of editing lots of measurements to change data sources or measurement parameters? Centralize control with DOC_SETs and Output Equation variables.


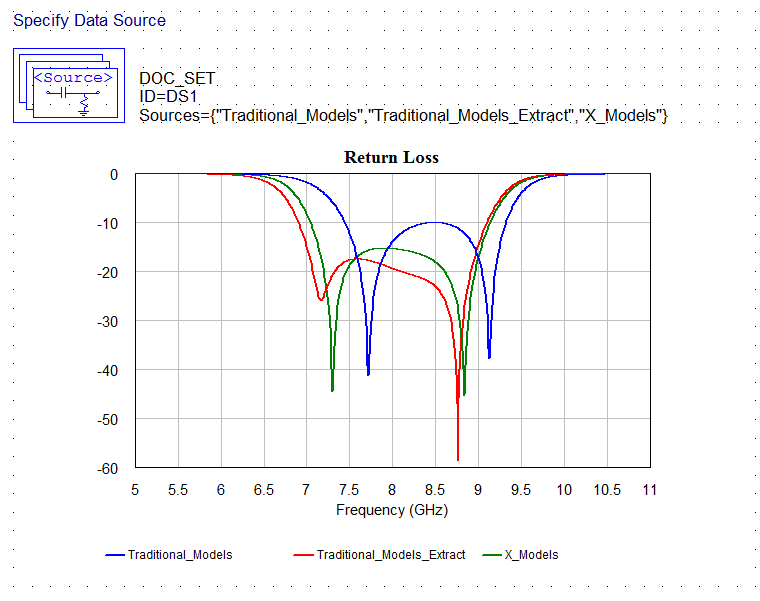
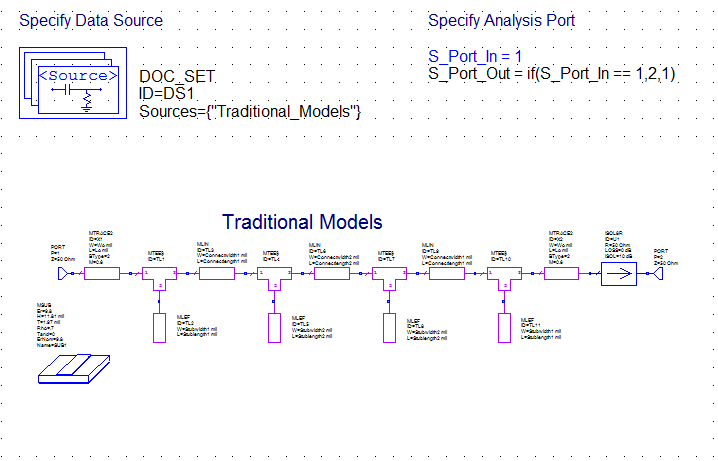
Centralized control of measurement data sources and parameters

The new DOC_SET element adds a way control Measurement Data Sources in a single location rather than editing many Measurements at once to change the Data Source. Similarly, using Output Equation page variables in Measurements allows centralized measurement parameter control for quick, easy updates in one location

The demo opens the project, maximizes an Output Equations page, simulates, and opens the tuner.

  1. Change all of the measurements to use extracted models with just a few clicks.
    • Edit the DOC_SET element to switch the Document from Traditional_Models to Traditional_Models_Extract
    • Note that all the graphs update with the new data source and the schematic shown is now Traditional_Models_Extract.
  2. Change all of the measurements to use X_Models with just a few clicks.
    • Edit the DOC_SET element to switch the Document from Traditional_Models_Extract to X_Models
    • Note that all the graphs update with the new data source and the schematic shown is now X_Models.
  3. Change all of the measurements to plot all three model types
    • Edit the DOC_SET element to switch all the Data Sources (Traditional_Models, Traditional_Models_Extract, and X_Models)
    • Note that all the graphs update with all the new Data Sources and that the schematic shown is the first source in the list on the DOC_SET.
  4. Change the value of the S_Port_In variable to 2.
    • Note that the all the measurements on all the Graphs update (S11 plots are now plotting S22 and the S21 plot is now plotting S12).

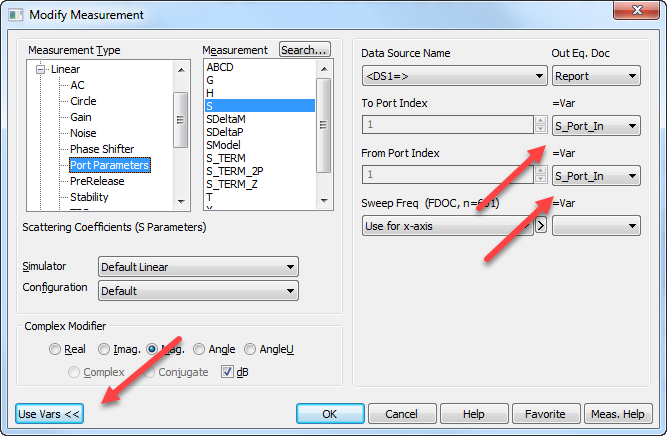
Exploring DOC_SETs and variables in Measurement parameters

  1. Double click on the Return Loss Graph to activate the view.
  2. Right click on the Return Loss Graph and choose Modify Measurement and select the Measurement from the list
  3. Note the new Use Vars button on the lower left side of the Modify Measurement dialog; this button enables the use of DOC_SETs and Output Equation variables in Measurement Parameters.
  4. Make the dialog larger if needed to see all the Measurement parameters
  5. Note the Measurement Data Source Name is set to <DS1=> which is the name of the DOC_SET element in the Report Output Equations page
  6. Note the To Port Index and From Port Index are set to use the S_Port_In variable define on the Report Output Equations page. The drop down makes it easy to only choose variable that exist.

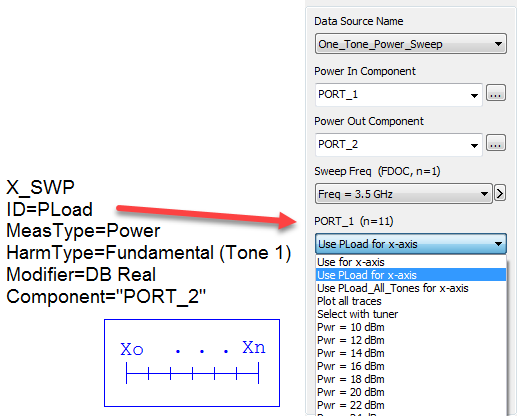
Effortlessly plot any measurement vs. output power.

Plotting vs. Output Power with X_SWP

The demo opens the project, maximizes an Output Equations page, simulates

License requirements: Nonlinear simulator (MWO-2XX)

  1. Note the X_SWP blocks on the Schematic that allow the user to specify what to plot (power, voltage, current), how to measure it (spectrum analyser style, power meter style, etc.) and where to measure it.
  2. Double click one of the Graphs to activate the view.
  3. Right click on the blue trace measurement in the legend, choose "Modify Measurement," and note that it uses the old PlotVs measurement that requires one measurement definition for the x-axis and one measurement definition for the y-axis.
  4. Right click on the red trace measurement in the legend, choose "Modify Measurement," and note that it is a "normal" measurement to plots vs. output power in the PORT_1 drop down by choosing the appropriate X_SWP ID..
  5. If desired, inspect all the graphs in the Report One Tone and Report Two Tone Output Equation pages to explore different X_SWP configurations.

Personalize Graphs with infinite trace color choices.