Go to playground home.

Measurements

This page lists improvements to measurement functionality in the AWR Design Environment.


V15


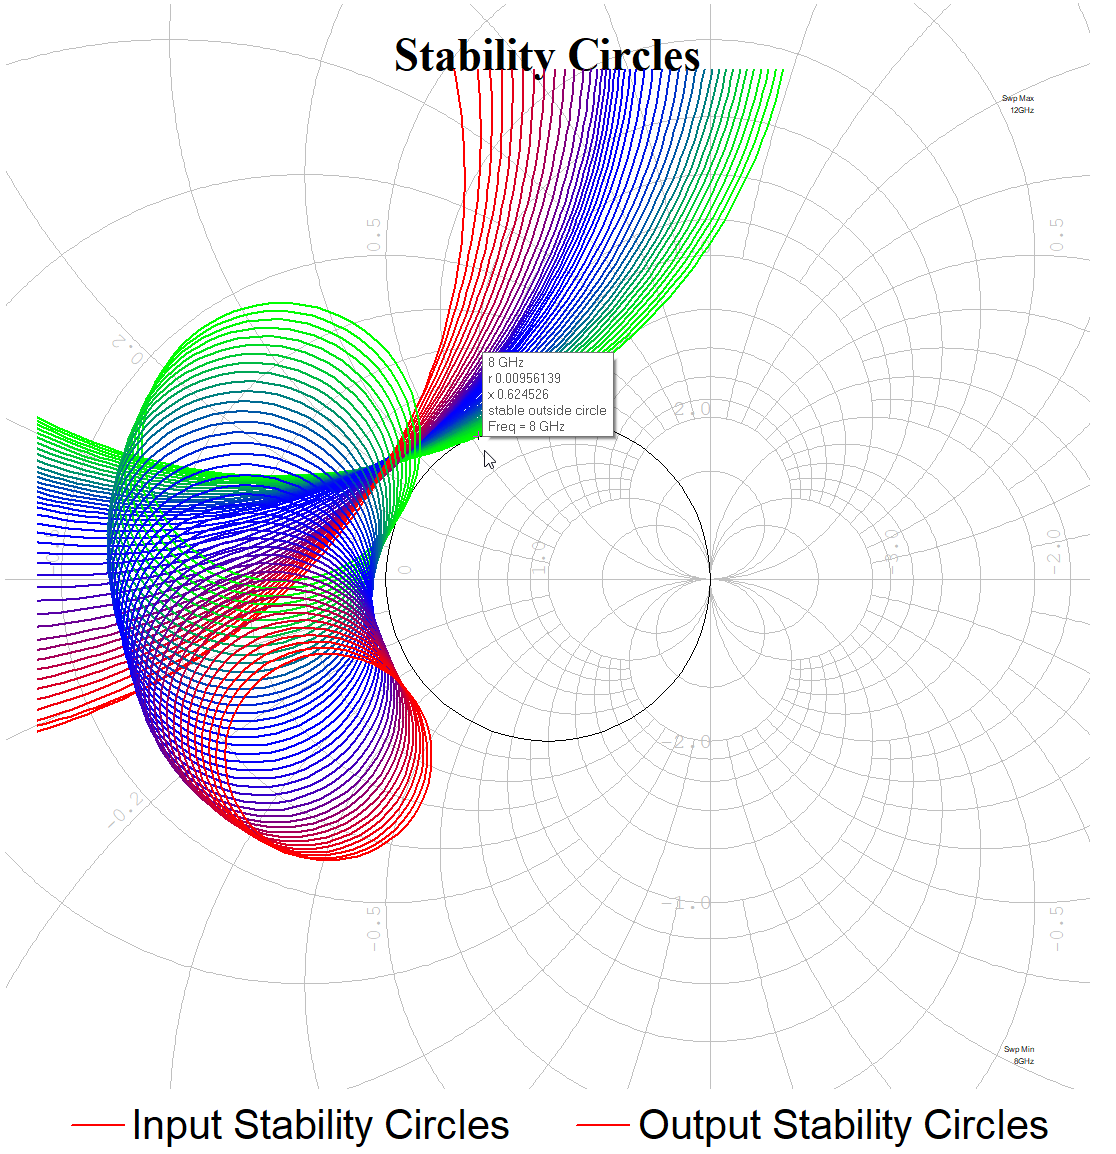
Decipher Ambiguous Stability and Passivity Data with Measurement Tooltips

This demo opens the project and tiles the relevant graphs for viewing stability tooltips.

  1. In the "Stability Circles" graph click on any of the stability circles.
    • The cursor tooltip displays relevant information about the selected circle, including if stability is inside or outside of the circle.
  2. Open the "Passive" graph and click on the trace and move the cursor across frequency.
    • The cursor tooltip displays whether or not the structure is passive.

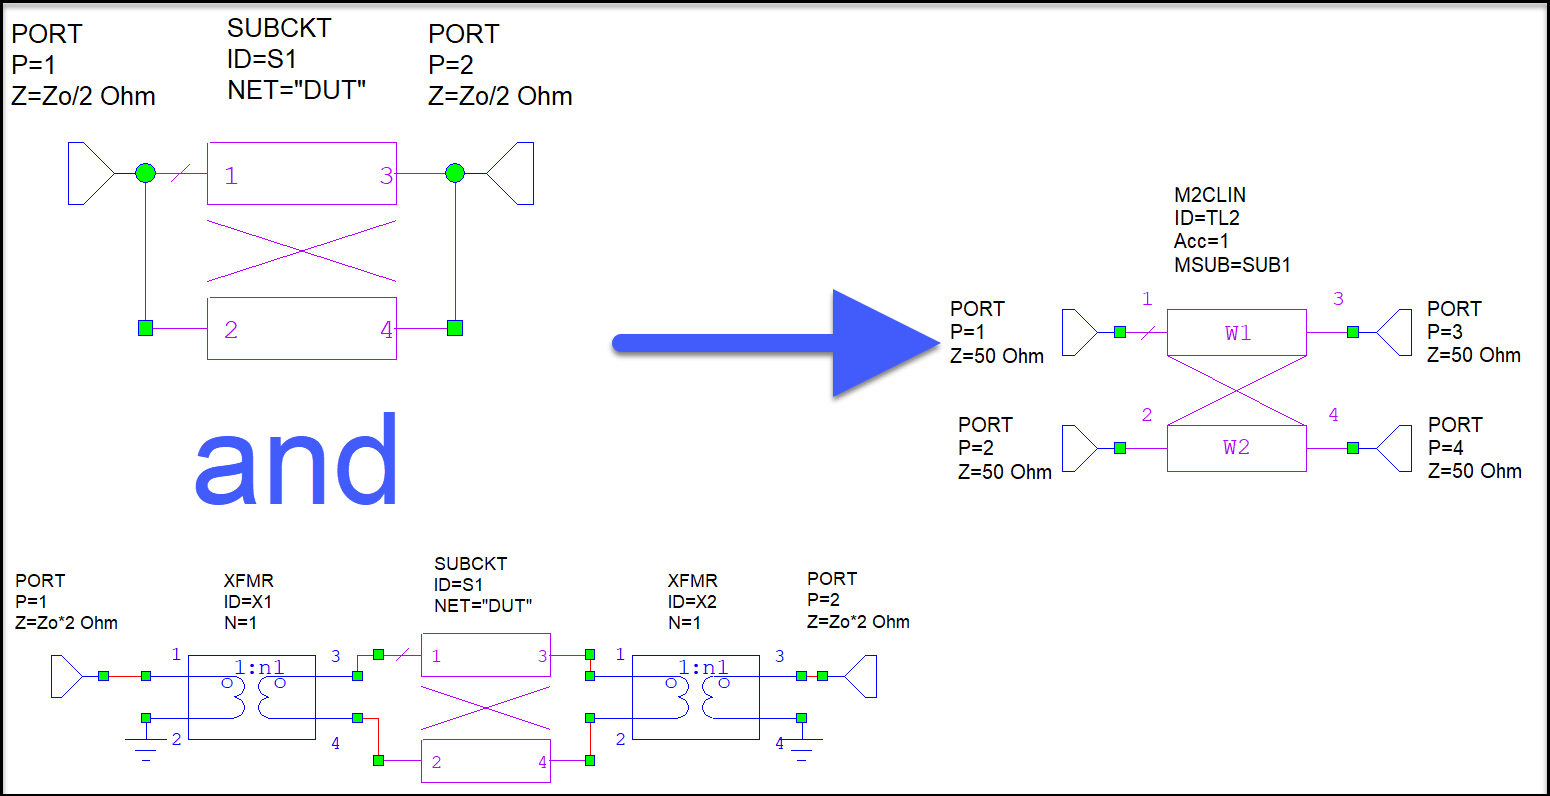
Re-use Test Benches for Single-ended and Differential Measurements

This demo opens the project and tiles the relevant graphs and test-benches for viewing mixed mode S-parameters.

  1. Three test-benches display. Prior to using the Smm measurement, multiple test-benches with XFMR or MMCONV elements were required to view both differential and common mode S-parameters.
  2. The Smm measurement allows use of a single test-bench to analyze both differential and common mode S-parameters.
  3. Notice that the Direct measurements both point to the DUT while the TB Required measurements point to their respective test-benches.
  4. Open the "Common Mode Rejection Ratio" graph. The CMRR measurement allows the common mode rejection ratio calculation to be performed without the need for Output Equations.

V14


This page contains improvements to measurement functionality in the AWR Design Environment.

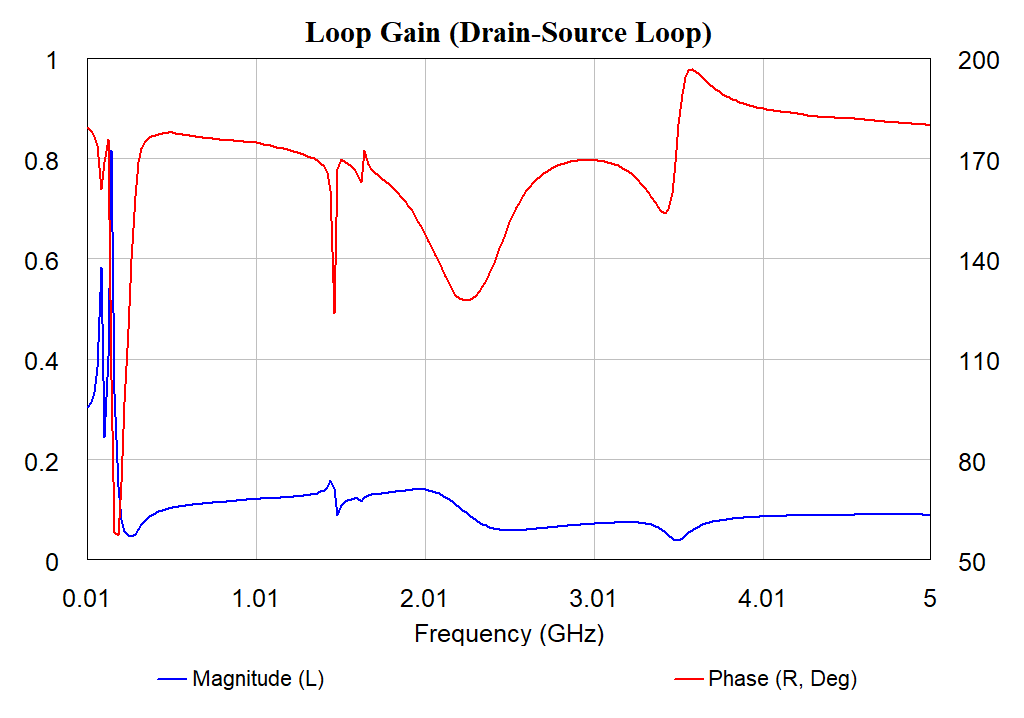
Check loop gain by simply pointing measurements to the desired device node.

Measure Loop Gain of Internal Branches of Devices

This demo opens the project and tiles the relevant windows and instructions for measuring loop gain.

  1. The loop gain from the drain-source current source is being measured directly from the exposed internal branch of the device.
  2. This method of measuring loop gain is supported for models that have the internal branches exposed.
  3. Look at the measurements to see how the branch is selected.
    • Click the ellipsis in the measurement to view the schematic. Push down through hierarchy to the device level. Then the intrinsic pins become available for selection in the pane on the left.

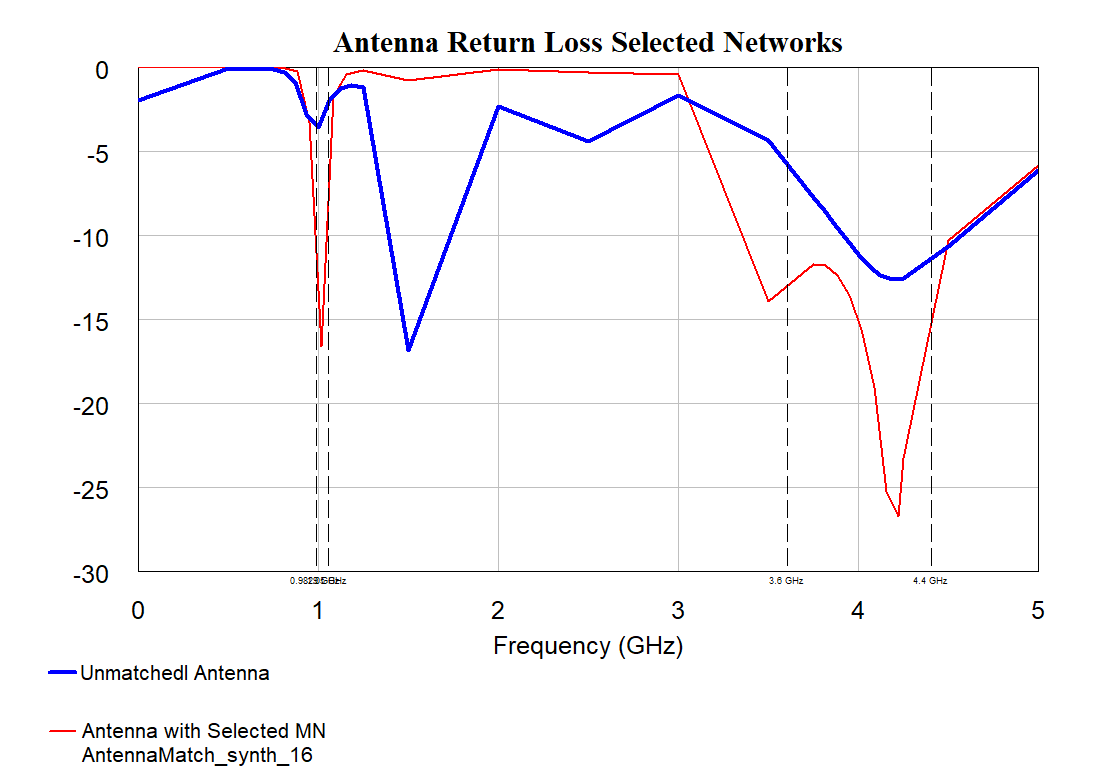
Easily compare circuit performance when many load/source matching network possibilities exist.

S_Term Measurements

This demo opens the project and tiles the relevant windows and instructions to learn how to use S_TERM measurements.

  1. Look at the second measurement on the Antenna Return Loss All Network graph. This is a single S_TERM measurement that is plotting the s-parameters of the antenna with five unique matching networks connected.
    • This is much simpler than creating five unique test benches, one for each circuit setup.
  2. Look at the second measurement on the Antenna Return Loss Selected Network graph. This is a single S_TERM measurement that is plotting the s-parameters of the selected antenna matching network in the <AntennaMatch_synth> User Folder.
    • Click on a matching network in the <AntennaMatch_synth> user folder to show the s-parameters for that matching network with the antenna.

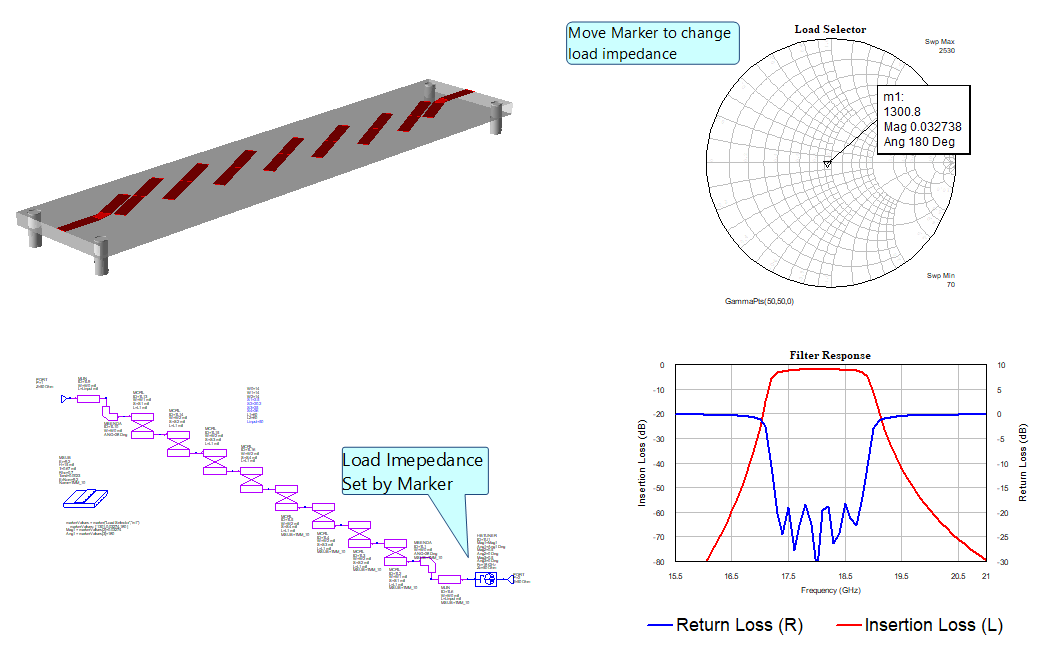
Apply load impedances graphically with floating Smith Chart markers.

GammaPts Measurement

This demo opens the project and tiles the relevant windows to illustrate the use of the GammaPts measurement on a smith chart with a marker to set load impedances in a schematic. This methodology works for any measurement since the markers are setting the HBTuner parameters directly, however, since the schematic is being updated as the marker is moved it does require a re-simulation.

  1. Double-click on the schematic to activate the window.
  2. Zoom in on the load to see the HBTuner element that is controlling the impedance.
  3. Double-click on the Smith Chart and grab and drag the Marker to set the load impedance of the filter.
  4. Simulate to see how the impedance change affects the filter performance.

V13


This page contains improvements to measurement functionality in the AWR Design Environment.

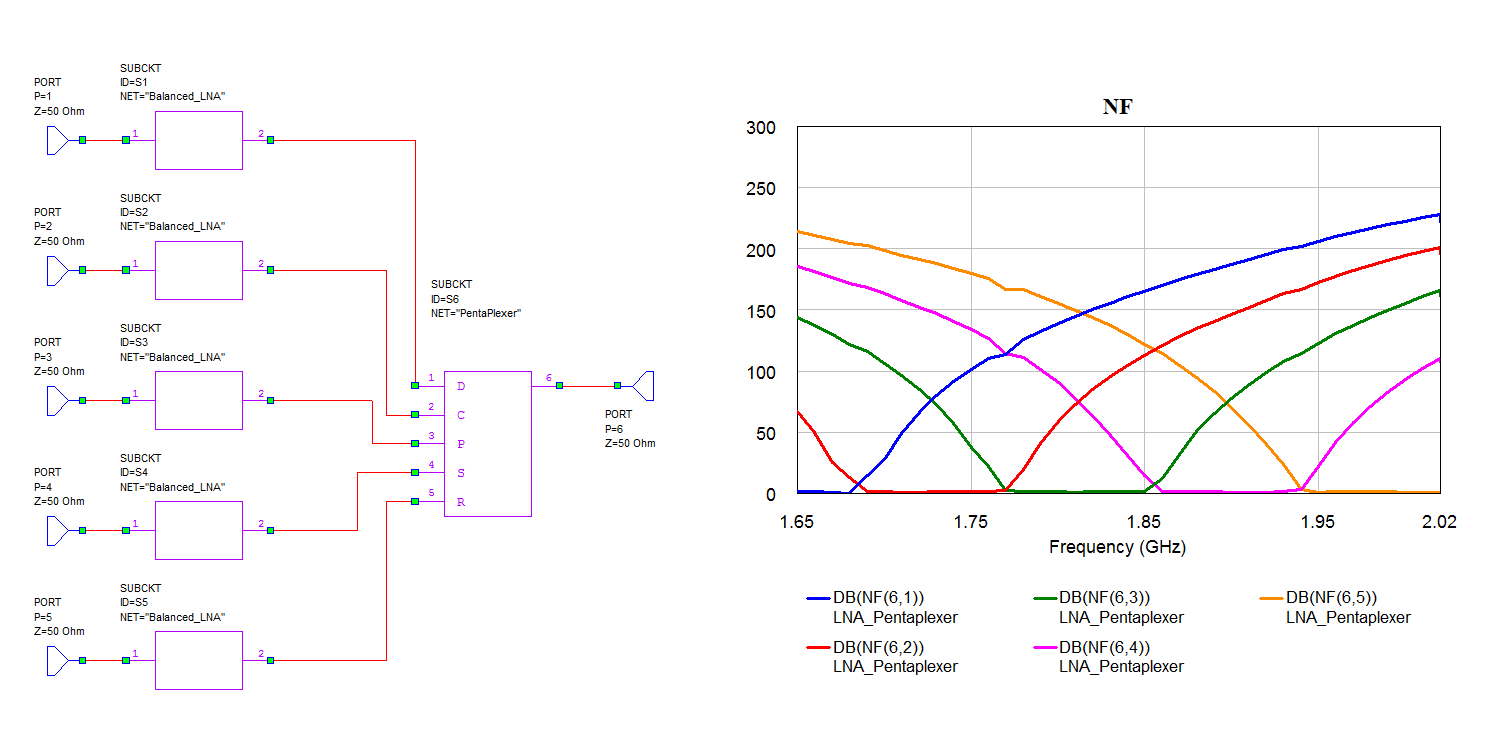
Reduce multiple test benches to one with the ability to make 2-port measurements like noise figure or max gain on N-port networks.

Make 2-port Network Measurements on N-port Schematics

The demo opens the project, tiles a graph showing 2-port NF measurements and the schematic on which those measurements are made, and simulates.