This page contains improvements to the AWR Design Environment for visualizing and analyzing data.
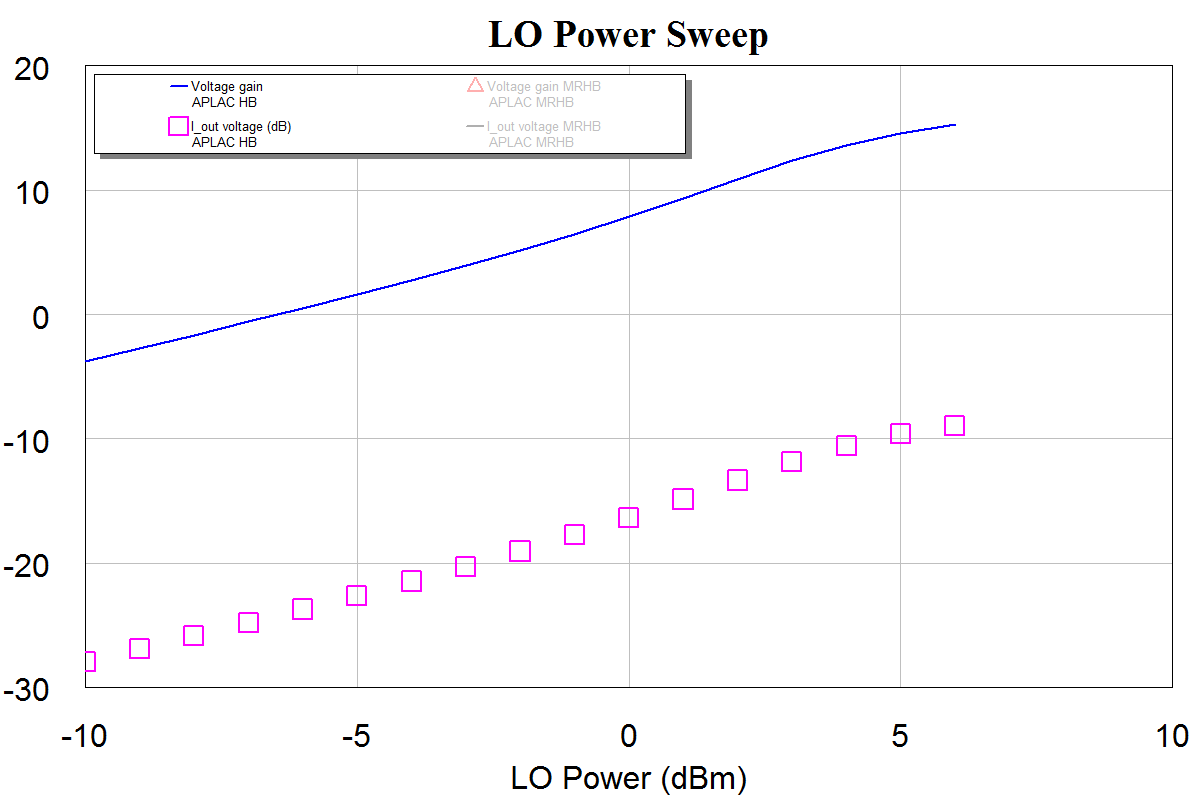
Why wait until your simulation is complete to see answers? See live simulation results while the simulation is running.See Simulation Results While Simulation RunsThe demo opens the project and maximizes a graph to show the waveforms as they are available from the simulator after the simulation starts.
|
|
|
|
|
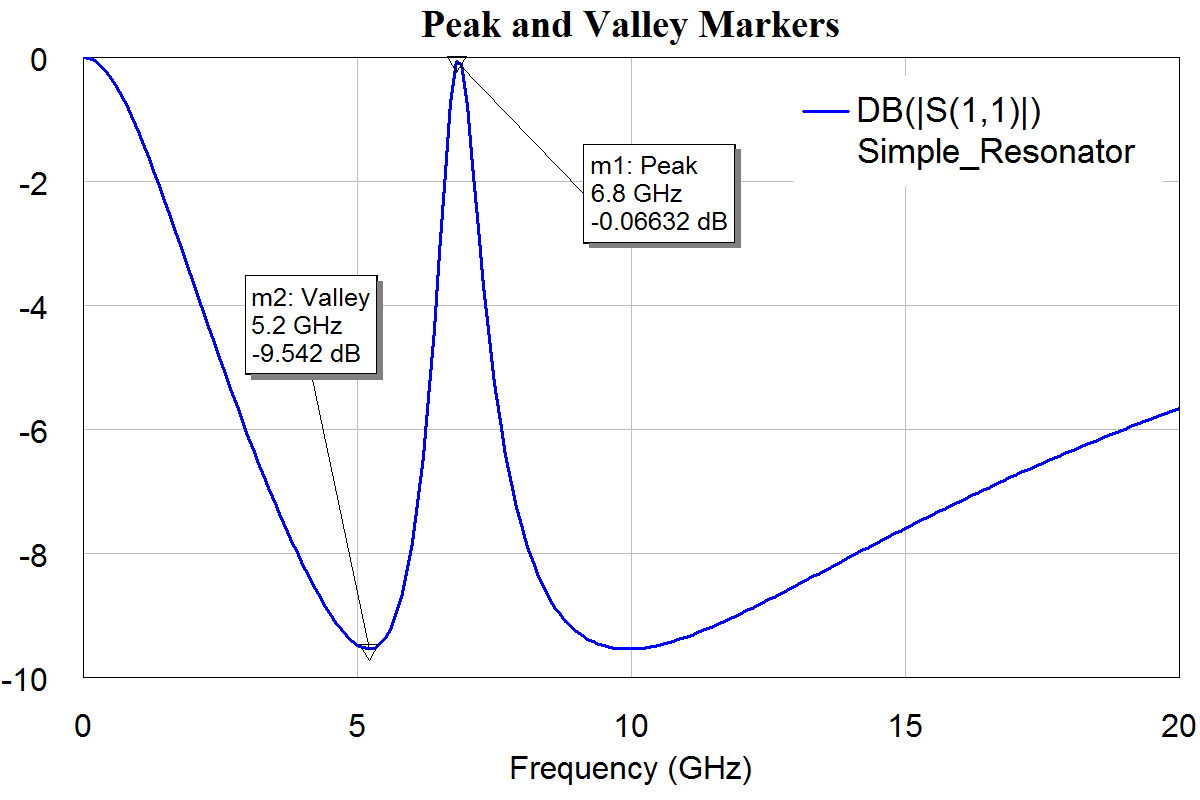
Explore results with intelligent data markers that lock to metrics such as maximum gain or 3 dB roll-off frequency.Intelligent Markers Based on Performance SpecificationsThe demo opens the project, tiles graphs for each new marker type, simulates and opens the tuner.
|
|