This page contains improvements to the AWR Design Environment related to design flows.
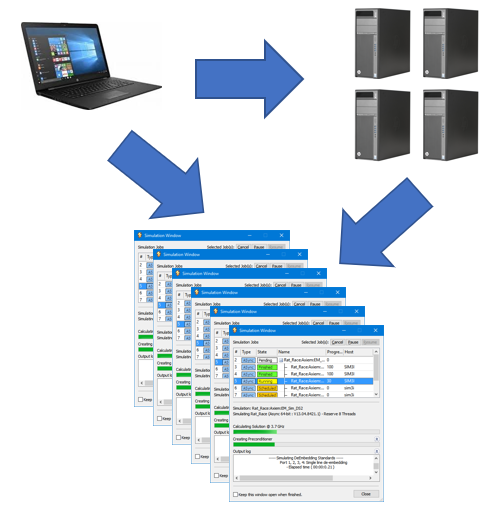
Dramatically increase simulation throughput with parallel and remote simulation. |
|
|
|
|
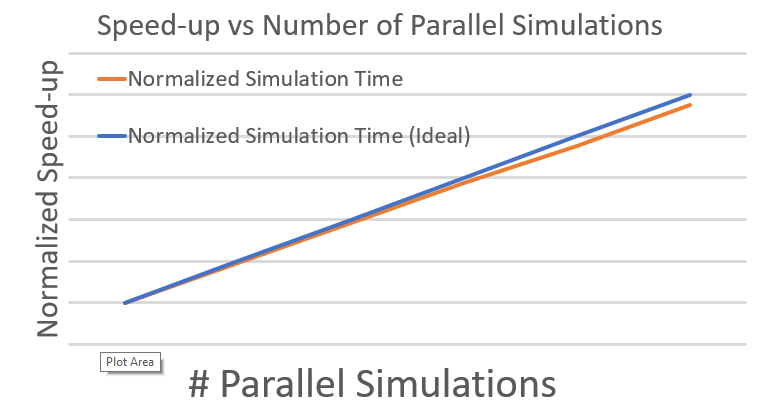
Parallel and remote simulationSimultaneously run multiple simulations on the same computer or many computers with parallel local and remote simulation. Take advantage of parallel top-level simulations, sweeps, optimization analysis, and yield analysis.* License requirements: Parallel simulation requires TOK-200 licenses. Remote simulation requires the same license feature set that the user has checked out on their machine. Please contact your local AWR sales representative if interested in learning more or demoing this feature.
|
|
|
|
|
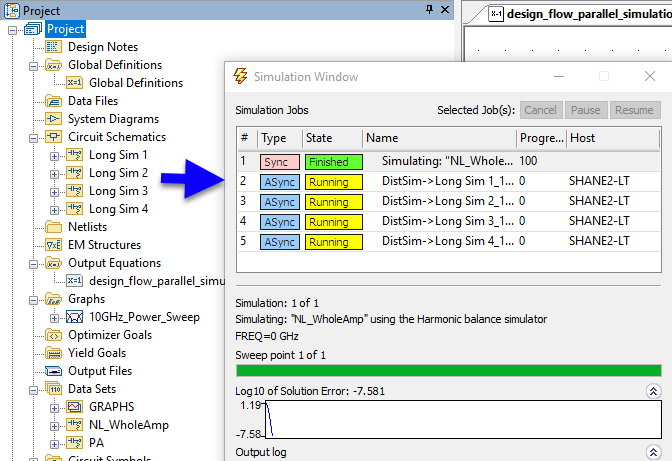
Top Level SimulationsRun multiple top level simulations in parallel locally or remotely. Every measurement data source or EM Structure is a top level simulation and running them in parallel provides a significant performance increase. The project will open and 4 intentionally slow top level simulations will simulate.
|
|
|
|
|
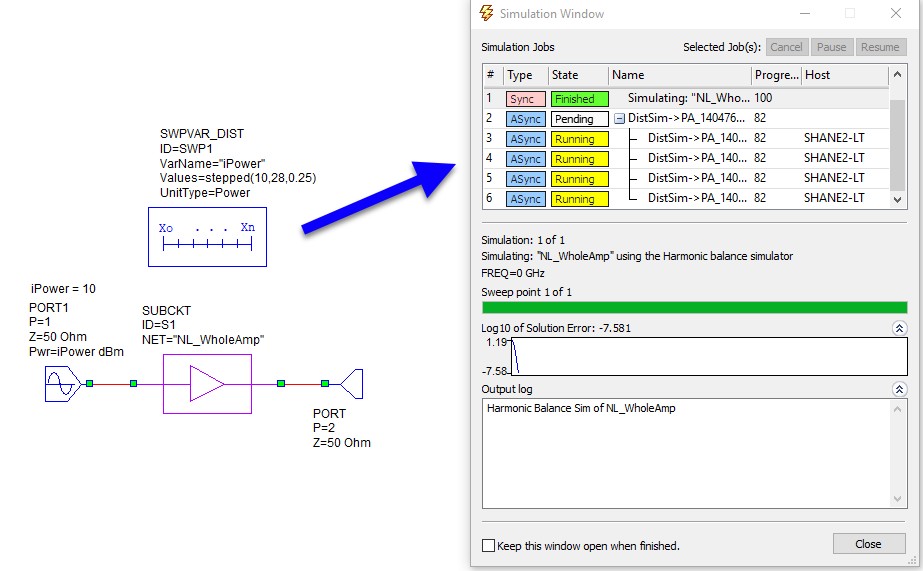
SweepsRun multiple sweeps in parallel locally or remotely. Some sweep run very efficiently in parallel (i.e. each frequency point of a power sweep, swept EM analysis, etc.). The project will open and 4 intentionally slow sweeps will start.
|
|
|
|
|
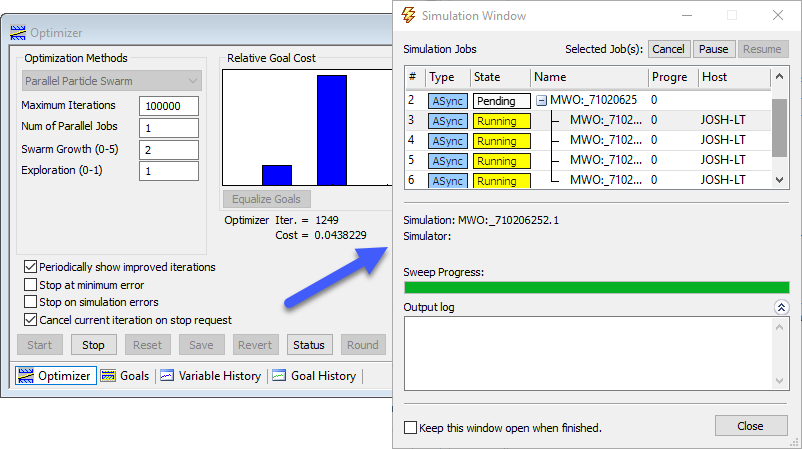
OptimizationRun optimization iterations in parallel locally or remotely. Advanced optimization algorithms (Parallel Advanced Genetic Algorithm and Parallel Particle Swarm) take advantage parallel iterations for increased performance. The project will open and a parallel optimization will start.
|
|
|
|
|
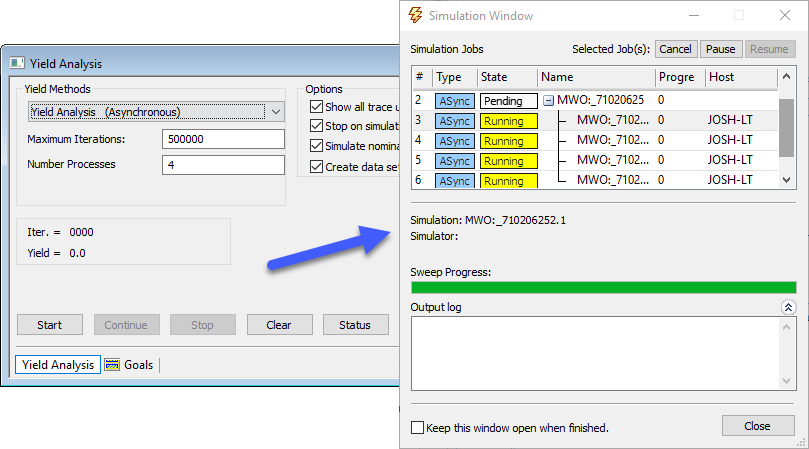
YieldRun yield iterations in parallel locally or remotely. Yield analysis lends itself well to parallel iterations for increased performance. Parallel yield analysis is not available in V14.0. If you have interest in this capability, please contact AWR Product Marketing |
|
|
|
|
Jump-start matching network design using the Network Synthesis Wizard. |
|
|
|
|
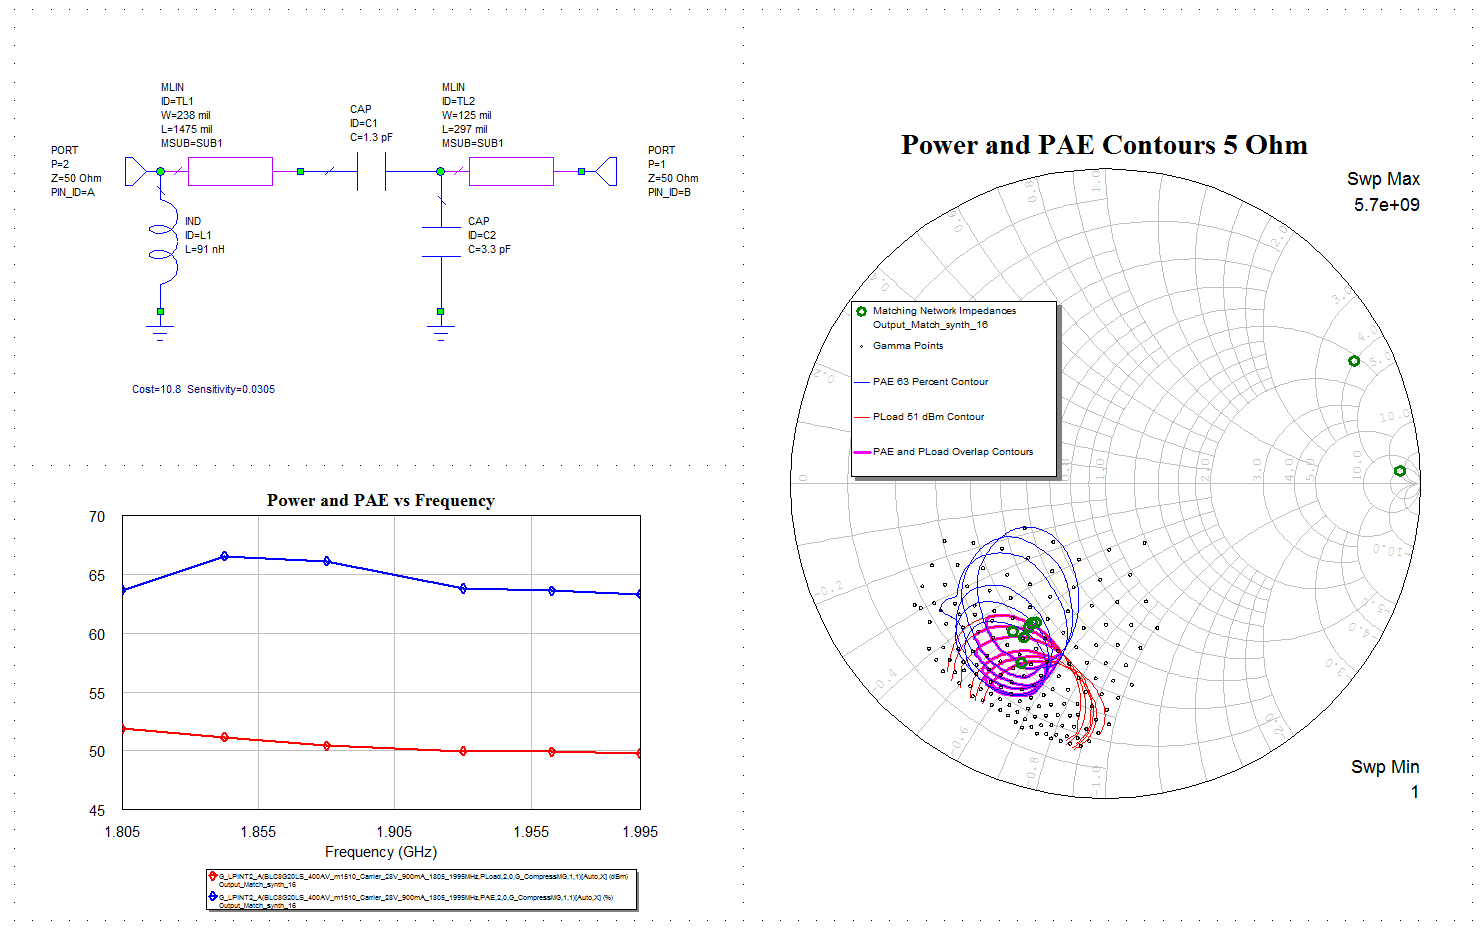
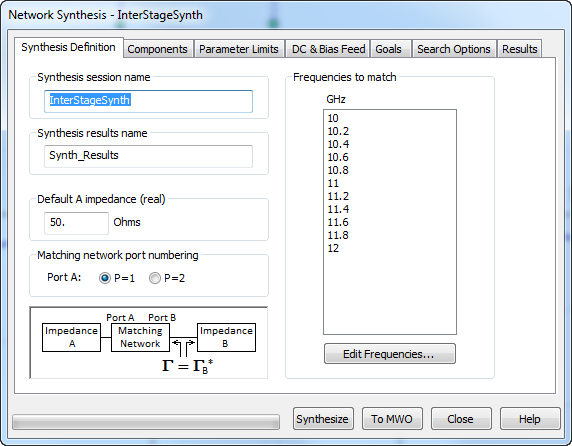
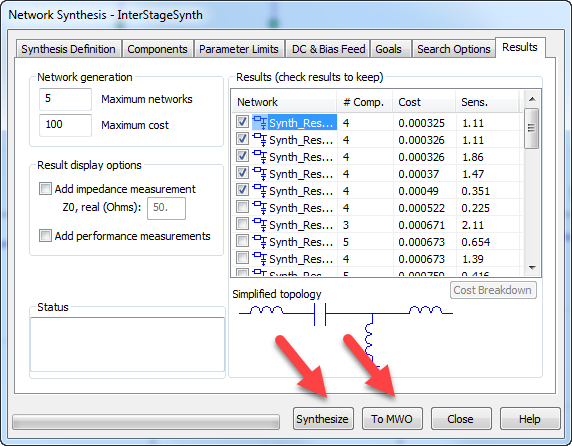
Matching Network Wizard OverviewThe Network Synthesis Wizard allows the user to specify goals and components to generate matching network topologies in a matter of minutes. In this example an interstage matching network is designed to meet optimize power transfer between two non 50 Ohm networks. |
|
|
|
Additional Network Synthesis Wizard examples can be found on the antenna and design flow pages. The project will open to show the Matching Network Report Output Equations Page and simulate. License requirements: Network Synthesis (SWS-100)
|
|
|
|
|
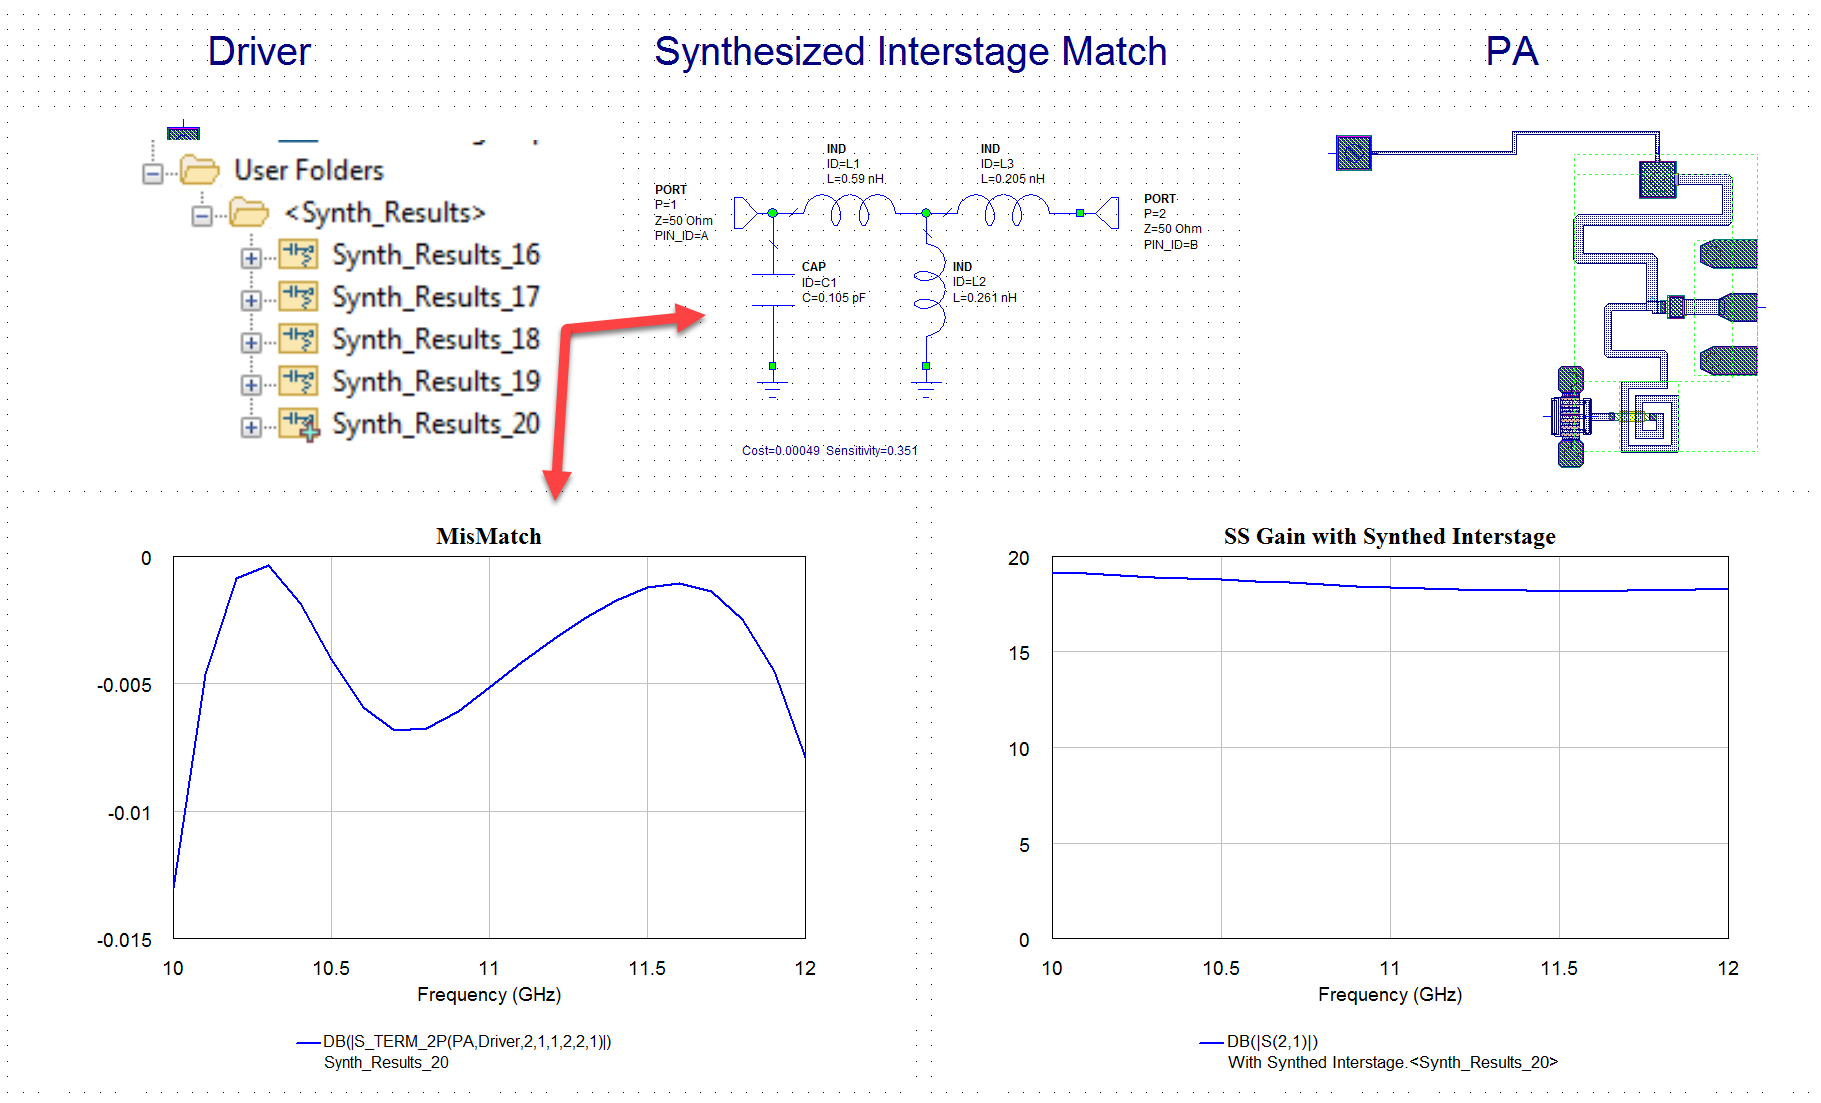
Synthesizing and sending results to Microwave Office
|
|
|
|
|
Exploring results
|
|